Starting to think probabilistically
conceptual
probability
Dice Rolling
Scenario
You’re playing Dungeons and Dragons, and you’ve encountered a tough-looking highwayman along the road who’s going to steal all your gold. In order to prevent violence from breaking out, your character is trying to convince the thief that your party has no gold, and to just let you on your way.
Give me a DC 17 Deception check.
Says the Dungeon Master. This means you need to roll a 20 sided die , and if it comes up 17 or higher, you succeed.
What is the probability of you succeeding on this check?
Probability
For reasoning through this, we’ll have to assume the following, which are not always shared assumptions with people dealing with probability on-the-ground.
There is no such thing as a lucky or unlucky .
The you’re about to roll is fair.
There is no such thing as a person who is a “good roller” or a “bad roller.”
Therefore any particular value is just as likely to show up as any other.
But, the question we’re asking is “what is the probability of rolling a 17 or higher.
| outcome | roll | total | probability |
|---|---|---|---|
| failure |
1, 2, 3, 4, 5, 6, 7, 8, 9, 10, 11, 12, 13, 14, 15, 16 |
16 | 16/20 = 0.8 |
| success |
17, 18, 19, 20 |
4 | 4/20 = 0.2 |
For categorical outcomes like this, probability will be the number of target outcomes divided by all possible outcomes.
probability:
\[ \frac{\text{success}}{\text{total}} \]
Odds
Another way to express the likelihood of success is in terms of “odds”. Instead of dividing the target outcome by the total number of outcomes, you divide the number of successful outcomes by the number of unsuccessful outcomes.
| success | failure | |
|---|---|---|
| : |
There’s a few different notational ways this can be expressed.
4:16
1:4
1/4
0.25
Odds will be important again when we come to modelling categorical data.
odds:
\[ \frac{\text{success}}{\text{failure}} \]
Rolling Damage (a.k.a. the central limit theorem)
Scenario
Your attempt at deception failed, and now you’re in combat. Your character is going to cast a spell that causes “2d6” damage. Meaning you’ll roll two 6 sided die and add up their values to calculate damage.
You know that the least you can roll is 2, if you rolled ,. You know the most you can roll is 12, if you rolled , .
But what is the most likely amount of damage you’ll roll?
There’s only one way for these two die to sum up to 2
- ,.
But, there are two ways for them to sum up to 3:
- ,
- ,
Expanding this out to all possible total values, we get this result.
| total | n | probability | |||||||
|---|---|---|---|---|---|---|---|---|---|
| 2 | | | | | | 1 | 0.03 | ||
| 3 | | | | | 2 | 0.06 | |||
| 4 | | | | 3 | 0.08 | ||||
| 5 | | | 4 | 0.11 | |||||
| 6 | | 5 | 0.14 | ||||||
| 7 | 6 | 0.17 | |||||||
| 8 | | 5 | 0.14 | ||||||
| 9 | | | 4 | 0.11 | |||||
| 10 | | | | 3 | 0.08 | ||||
| 11 | | | | | 2 | 0.06 | |||
| 12 | | | | | | 1 | 0.03 | ||
| total | 36 | 1 |
Even though there is a uniform probability of rolling 1 through 6 on each die, the probability of the sum of two rolls takes on a different shape.
You can experiment with how the total number of die, for a few different die types, affects the probability distribution
Code setup
Takeaways
- The total probability always = 1.
Continuous cases
Scenario
The encounter hasn’t gone well, and you’re now hiding in a shack. There’s a small slit cut out of one of the walls of the shack, and you ask the DM if you can see the highwayman outside. The DM says
The slit is very narrow, so you’ll only be able to look out if it if you’re exactly 71.5 inches tall.
What is the probability that you are 71.5 inches tall?
This is a problem, because height is “real valued”. There are not discrete increments along which people’s heights vary. Here are a few ways you could not be 71.5 inches tall:
you are 71.51 inches tall.
you are 71.501 inches tall.
you are 71.5001 inches tall.
Since there is only 1 way for you to be exactly 71.5 inches tall, and and infinitude of ways to not be 71.5 inches tall, the probability of being 71.5 inches tall is
\[ P(71.5) = \frac{1}{\infty} = 0 \]
But we can reason probabilistically about a range of values, using a “probability density function”. For example, the normal distribution, so called because it is so ubiquitous.
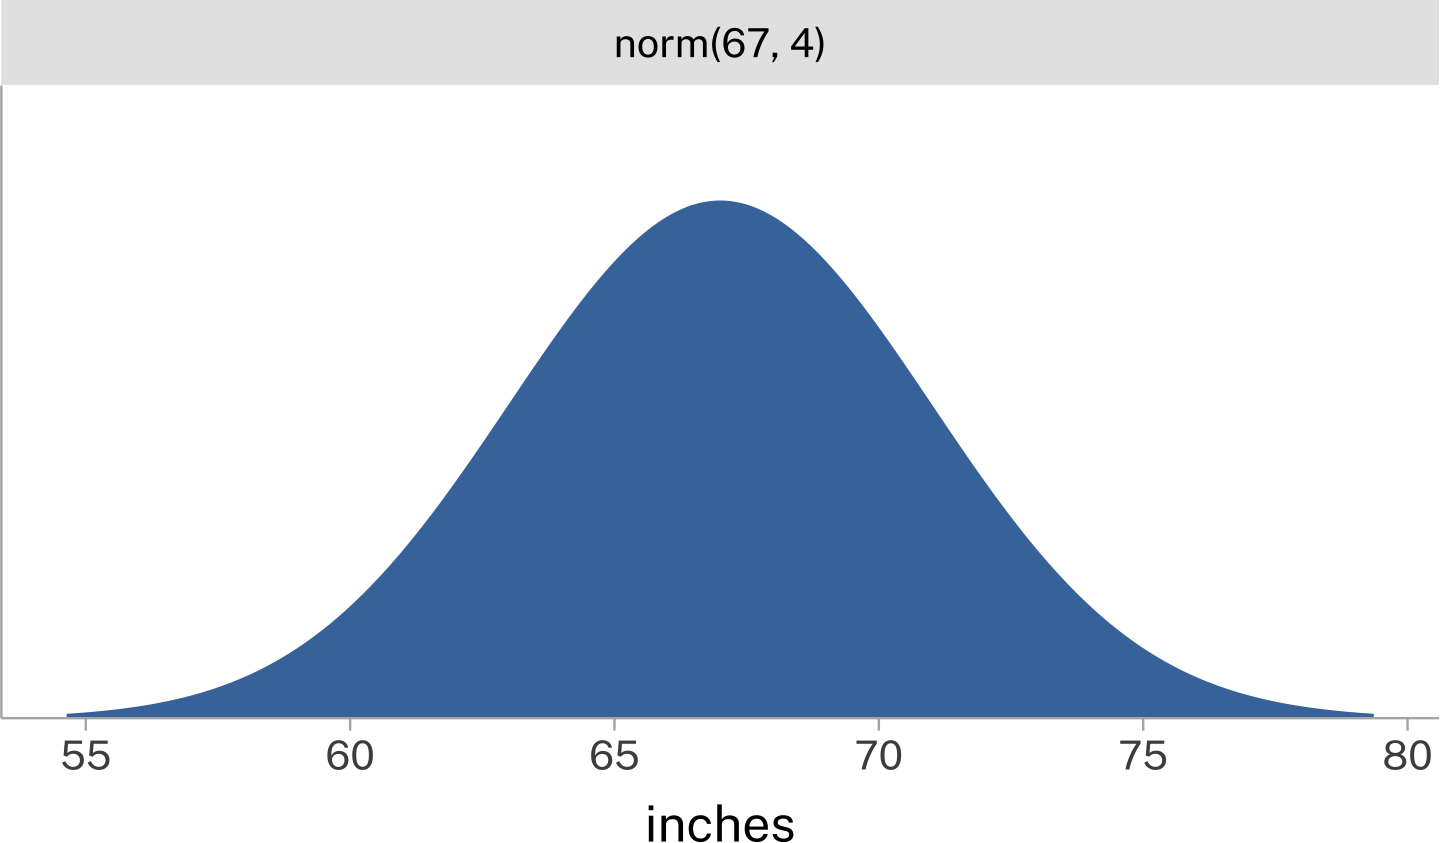
This distribution is like the categorical distributions above in that the area under the curve sums to 1. But unlike the distributions above, you can only evaluate ranges of it, not individual point values.
Scenario
With this in mind, you say
C’mon DM, give me a range. What if I can see through the slit in the wall if I’m between 70 inches and 72 inches?
The DM relents, and says ok.
Use the sliders below to work out the probability, given the distribution below, that you are between 70 and 72 inches.
Code setup
Bonus
Reuse
CC-BY 4.0
Citation
BibTeX citation:
@online{fruehwald2024,
  author = {Fruehwald, Josef},
  title = {Starting to Think Probabilistically},
  date = {2024-09-23},
  url = {https://lin611-2024.github.io/notes/meetings/2024-09-23_prob-thinking.html},
  langid = {en}
}
For attribution, please cite this work as:
Fruehwald, Josef. 2024. “Starting to Think
Probabilistically.” September 23, 2024. https://lin611-2024.github.io/notes/meetings/2024-09-23_prob-thinking.html.