Welcome
notes
conceptual
Welcome to the course
What is everything?
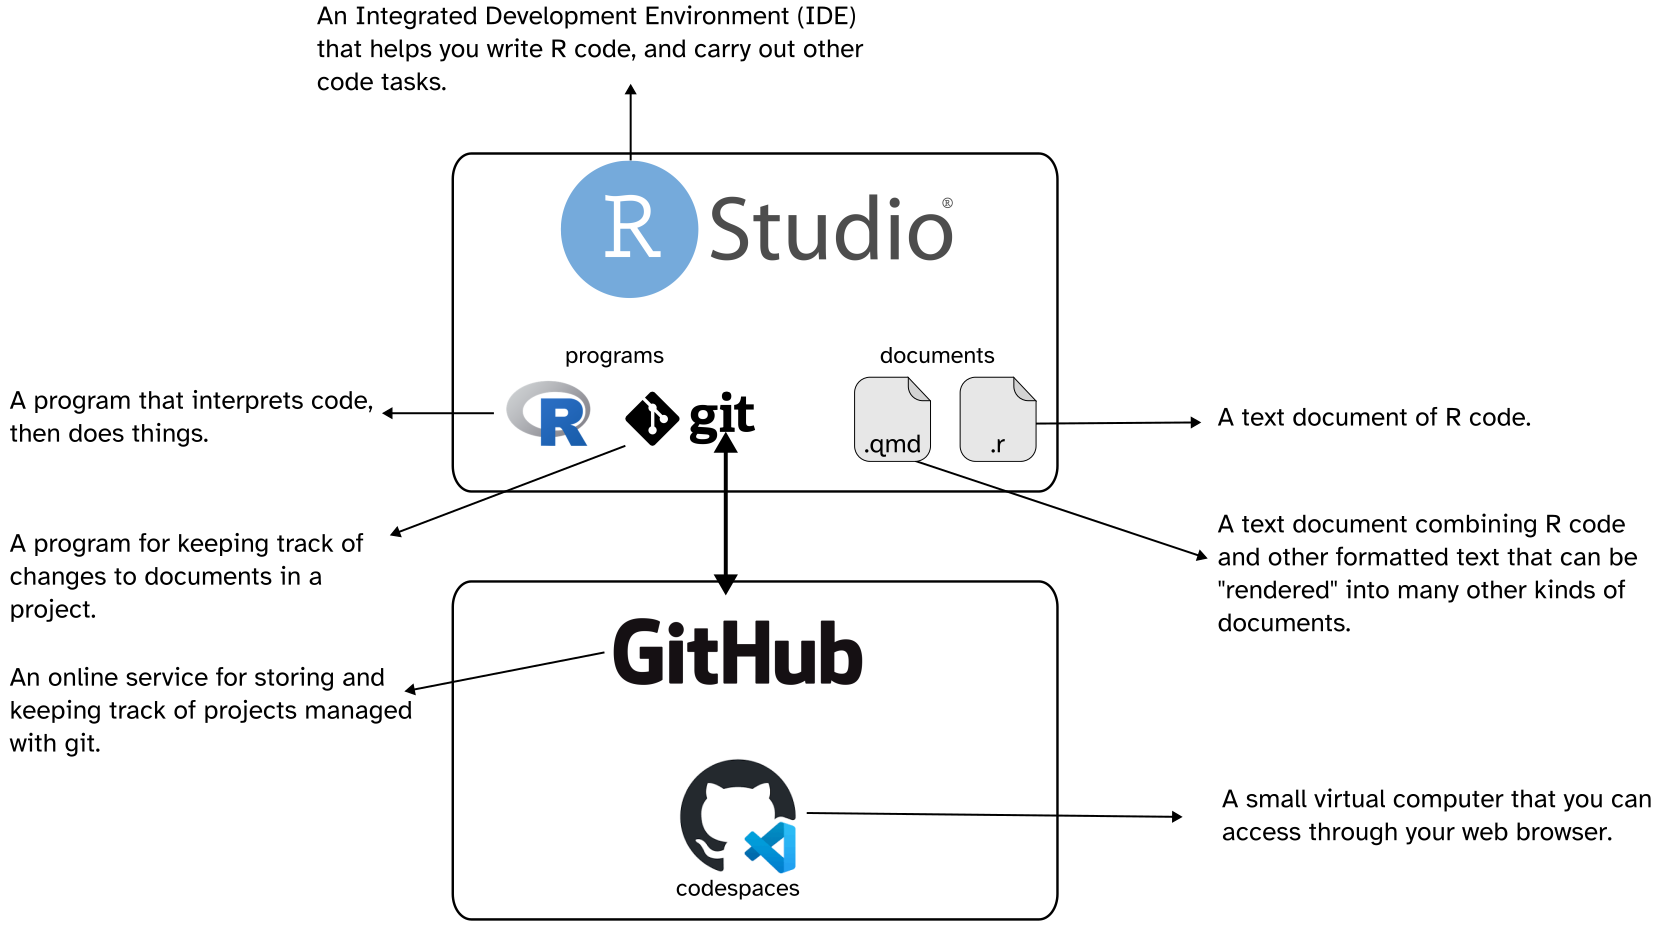
Firstly, in a quantitative methods class, you’re going to learn how to use some software. And in contemporary stats classes, you’ll “learn R”. But, there’s actually a whole ecosystem of tools and documents we’re going to use, so it’s worth conceptualizing how they hang together.
Software
- R
-
R is a programming language that has a lot of functionality built in for processing tabular data, and doing quantitative (statistical or otherwise) analysis.
- RStudio
-
RStudio is an IDE through which you can interact with the R program. It also has a lot of very useful authorship tools that we’ll be exploring.
Pause
If R is a program, why do we need another program to use it? Because, by default, R looks like this:
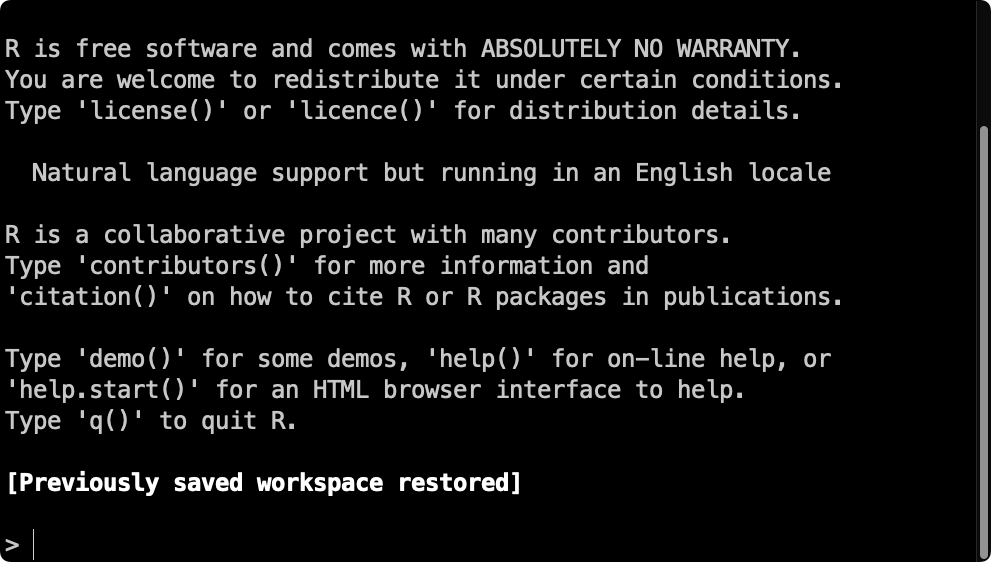
The > at the bottom of the image is where you type in R commands that you just know. RStudio provides a nicer way to work with R.
- git
-
git is a program for keeping track of changes you make to documents in a project. If you want to read more about why it’s good to use git, rather than, say, just Dropbox or OneDrive, I’d recommend this blog post.
Documents
All of the documents we’ll be writing directly will be “plain text”. In some sense, the file extensions don’t matter, but they are informative about what is in the document.
*.R-
We may or may not deal with R script files, but they contain only valid R code.
*.qmd-
Quarto documents contain both R code and markdown content that can be “rendered” into multiple other formats (e.g. html. pdf)
Services
- Github
-
Github is distinct from git. It is an online service for sharing and collaborating on projects that are managed with git.
- Github Codespaces
-
GitHub Codespaces are a ‘development environment’, running on a Virtual Machine. They’re like mini computers you can access through your web browser that get created just for the repository you launch one in. The actual memory and computation are being run on GitHub’s physical computers.
Dealing with everything
I’ve been using R nearly every day since 2008 (about 16 years). And when I do R programming, I get errors all. the. time. Being able to deal with errors that you don’t understand while using R is largely an issue of emotional regulation. And, like any other skill, it is something that can improved over time with focused attention.
Knitting Analogy
Below are two images. One is the first thing I ever knit: allegedly a hat. The other is the most recent cardigan I knit (which won second prize in the Cabled Garment category at the state fair!).
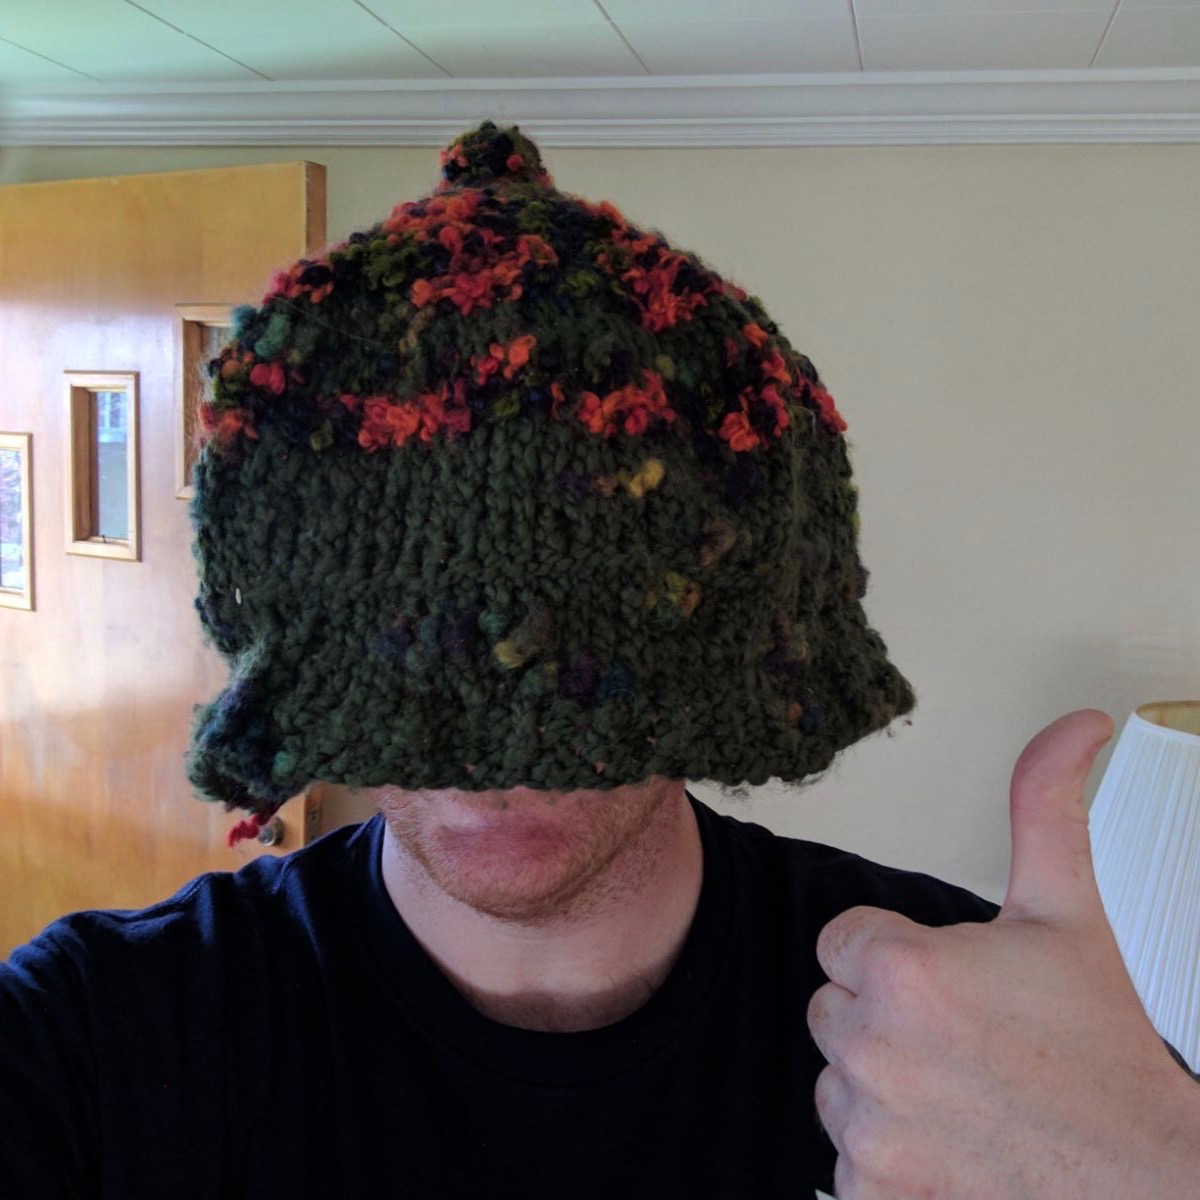

I was not “naturally” good at knitting. I got better because:
I knit a lot (almost every day).
I memorized a bunch of stuff.
Remembered where to look up the stuff I don’t have memorized.
My knitting became more “idiomatic” (i.e. I started knitting like how other knitters knit).
I learned how to identify and fix mistakes without undoing my entire project.
I developed good workspace hygiene & organization.
As I got the basics down, I started researching and incorporating fussy little details into my work.
A video game analogy
Sometimes, when you get an error in class and read it out loud to me, I’ll be able to tell what happened, or what code you need to adjust. I haven’t memorized all possible errors and how to fix them. I’ve made those errors so many times that I remember what I do to fix them.
In video game terms: I’ve fought that boss before, and I remember its moves.

Before “Stats”
Before we get to “stats,” we’re going to spend time on
Data visualization
Data organization
Data reshaping and transformation
If there is any aspect of this course which will save you time and heartache in the future, it is this portion. The actual data you wind up collecting and working with will hardly ever by as tidily organized as example datasets.
Figuring out how to get your data arranged in a way that is appropriate for even running a statistical analysis can take substantial time and effort. And that’s before you even get around to interpreting a regression model’s results.
“Stats”
There is a sort of folk-statistics out there that a statistical test is a method for bifurcating “effects” into those which are “real” and “true” versus those that are “spurious” and “false.”
That is not the approach we will take to stats in this course. I highly recommend reading the first chapter of Richard McElreath’s Statistical Rethinking (available as a preview pdf), which is called “The Golem of Prague.”
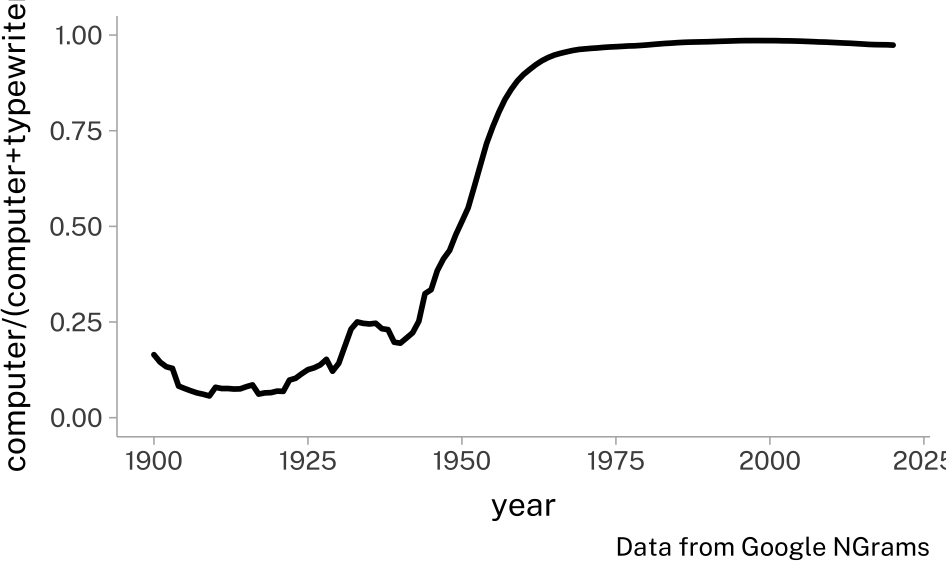
An important point he makes is that the relationship between our substantive hypotheses, the data we observe, and statistical model results stand in many-to-may relationships. For example, here is a figure from Google NGrams of frequency of the word “computer” proportional to the frequency of “computer” and “typewriter”.
Sticking to just the Inter-ocular Impact Test,1 it seems clear something happened. A possible hypothesis is that as computers replaced typewriters, usage of the word “computer” replaced usage of the word “typewriter.

We can sketch this relationship between hypothesis (Replacement) with the observed data (Proportion Shift).
flowchart LR
    r(Replacement)
    ps(Proportion Shift)

    r --> ps
But, if we plot the data differently, we can see that while the word “computer” had a sudden and massive surge in frequency, it didn’t really replace “typewriter”. “Typewriter” has is used a bit less often than it was before, but its decrease in frequency isn’t proportional to “computer”’s increase.
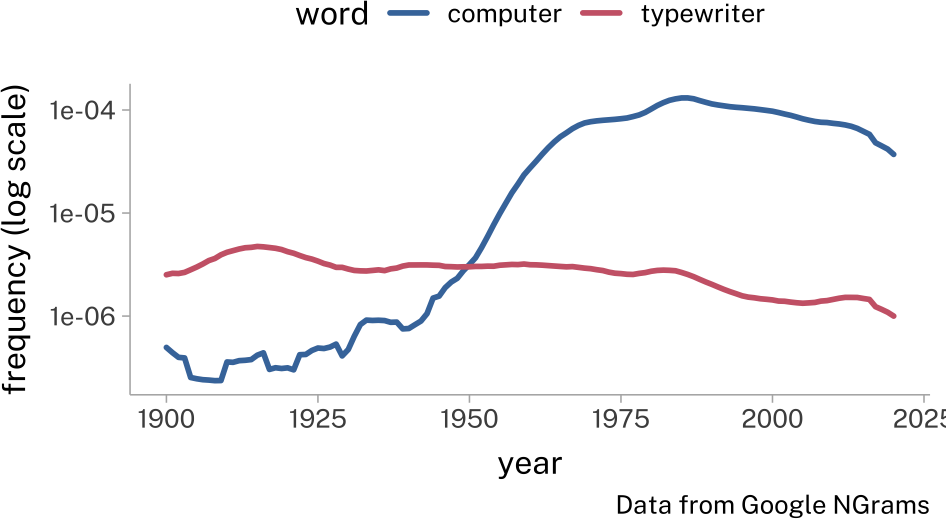
Instead, maybe it seems more like the word “computer” was new, novel, and became very popular. But this very different hypothesis is still consistent with the original data we plotted.
flowchart LR
    r(Replacement)
    ps(Proportion Shift)
    n(New, Novel and Popular)

    r --> ps
    n --> ps
The Upshot
We need to understand statistical models in order to utilize them well. But they never stand on their own. Instead, they are interpreted with respect to qualitative hypotheses.
Footnotes
👀↩︎
Reuse
CC-BY 4.0
Citation
BibTeX citation:
@online{fruehwald2024,
  author = {Fruehwald, Josef},
  title = {Welcome},
  date = {2024-08-26},
  url = {https://lin611-2024.github.io/notes/meetings/2024-08-26_first-meeting.html},
  langid = {en}
}
For attribution, please cite this work as:
Fruehwald, Josef. 2024. “Welcome.” August 26, 2024. https://lin611-2024.github.io/notes/meetings/2024-08-26_first-meeting.html.