library(tidyverse)
library(gt)Advanced Data Operations
tidyverse
recoding
Some very useful, ocassionally used Tidyverse functions
Some data tasks only come up every so often, but when they do, having the just right function to use is so key.
Finding the right function
Every once in a while, I’ll just scroll through the reference pages of the core tidyverse packages. They have pretty good naming conventions, so you can start to get an idea of what they can do from the name of the function. My goal is just to give my future self a “I think I saw something that can do this once” feeling when I’m dealing with a specific data task.
Important to remember
The two functions I think it’s important to just remember are:
stringr::str_detect()dplyr::case_when()
Pattern searching
str_detect() will search a string, or a vector of strings for a regular expression.
fruits <- c("raspberry", "cherry", "apple", "strawberry")

str_detect(
  fruits,
  "berry"
)
[1] TRUE FALSE FALSE TRUEFor any given thing you might want to do with a string, check out the stringr documentation.
“Vectorized Switch”
dplyr::case_when() is useful for creating new data columns, or recoding existing columns.
tibble(
month=month.name
) |>
mutate(
oysters = case_when(
str_ends(month, "r") ~ "yes",
.default = "no"
)
) |>
gt() |>
tab_header(
title = "Should you eat oysters?"
)- 1
-
If the month name ends in
"r", return"yes". Otherwise,"no"
| Should you eat oysters? | |
|---|---|
| month | oysters |
| January | no |
| February | no |
| March | no |
| April | no |
| May | no |
| June | no |
| July | no |
| August | no |
| September | yes |
| October | yes |
| November | yes |
| December | yes |
Examples
With just these two additional functions and what we’ve done in the tidyverse already, we can do some pretty powerful analyses.
Peterson & Barney
library(babynames)
library(phonTools)
data("pb52")
I noticed, when making a plot of the Peterson & Barney data, that there was some stripeyness to it.
pb52 |>
  ggplot(
    aes(
      x = f0,
      y = f1,
      color = f1/f0
    )
  )+
    geom_point()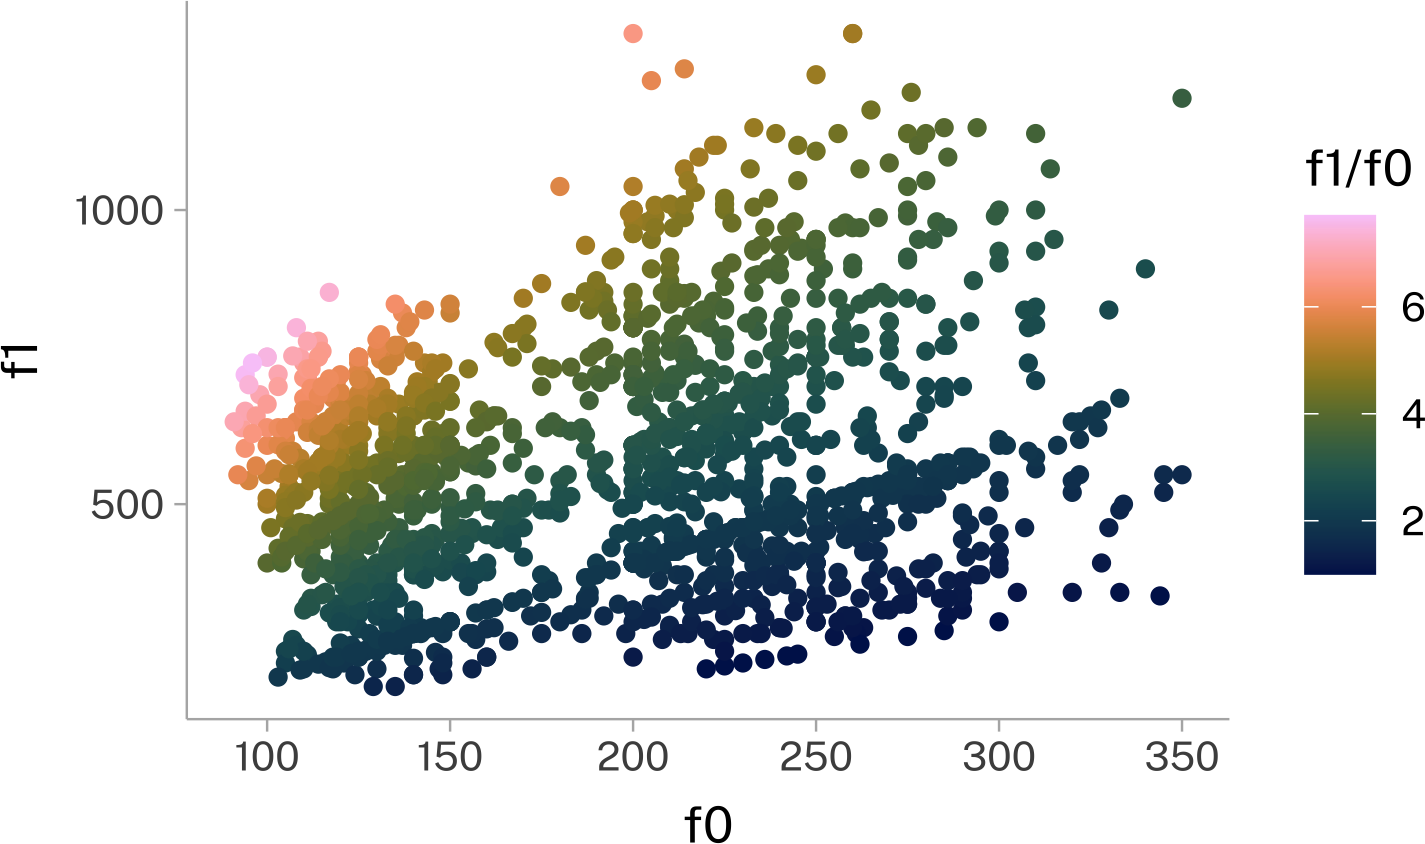
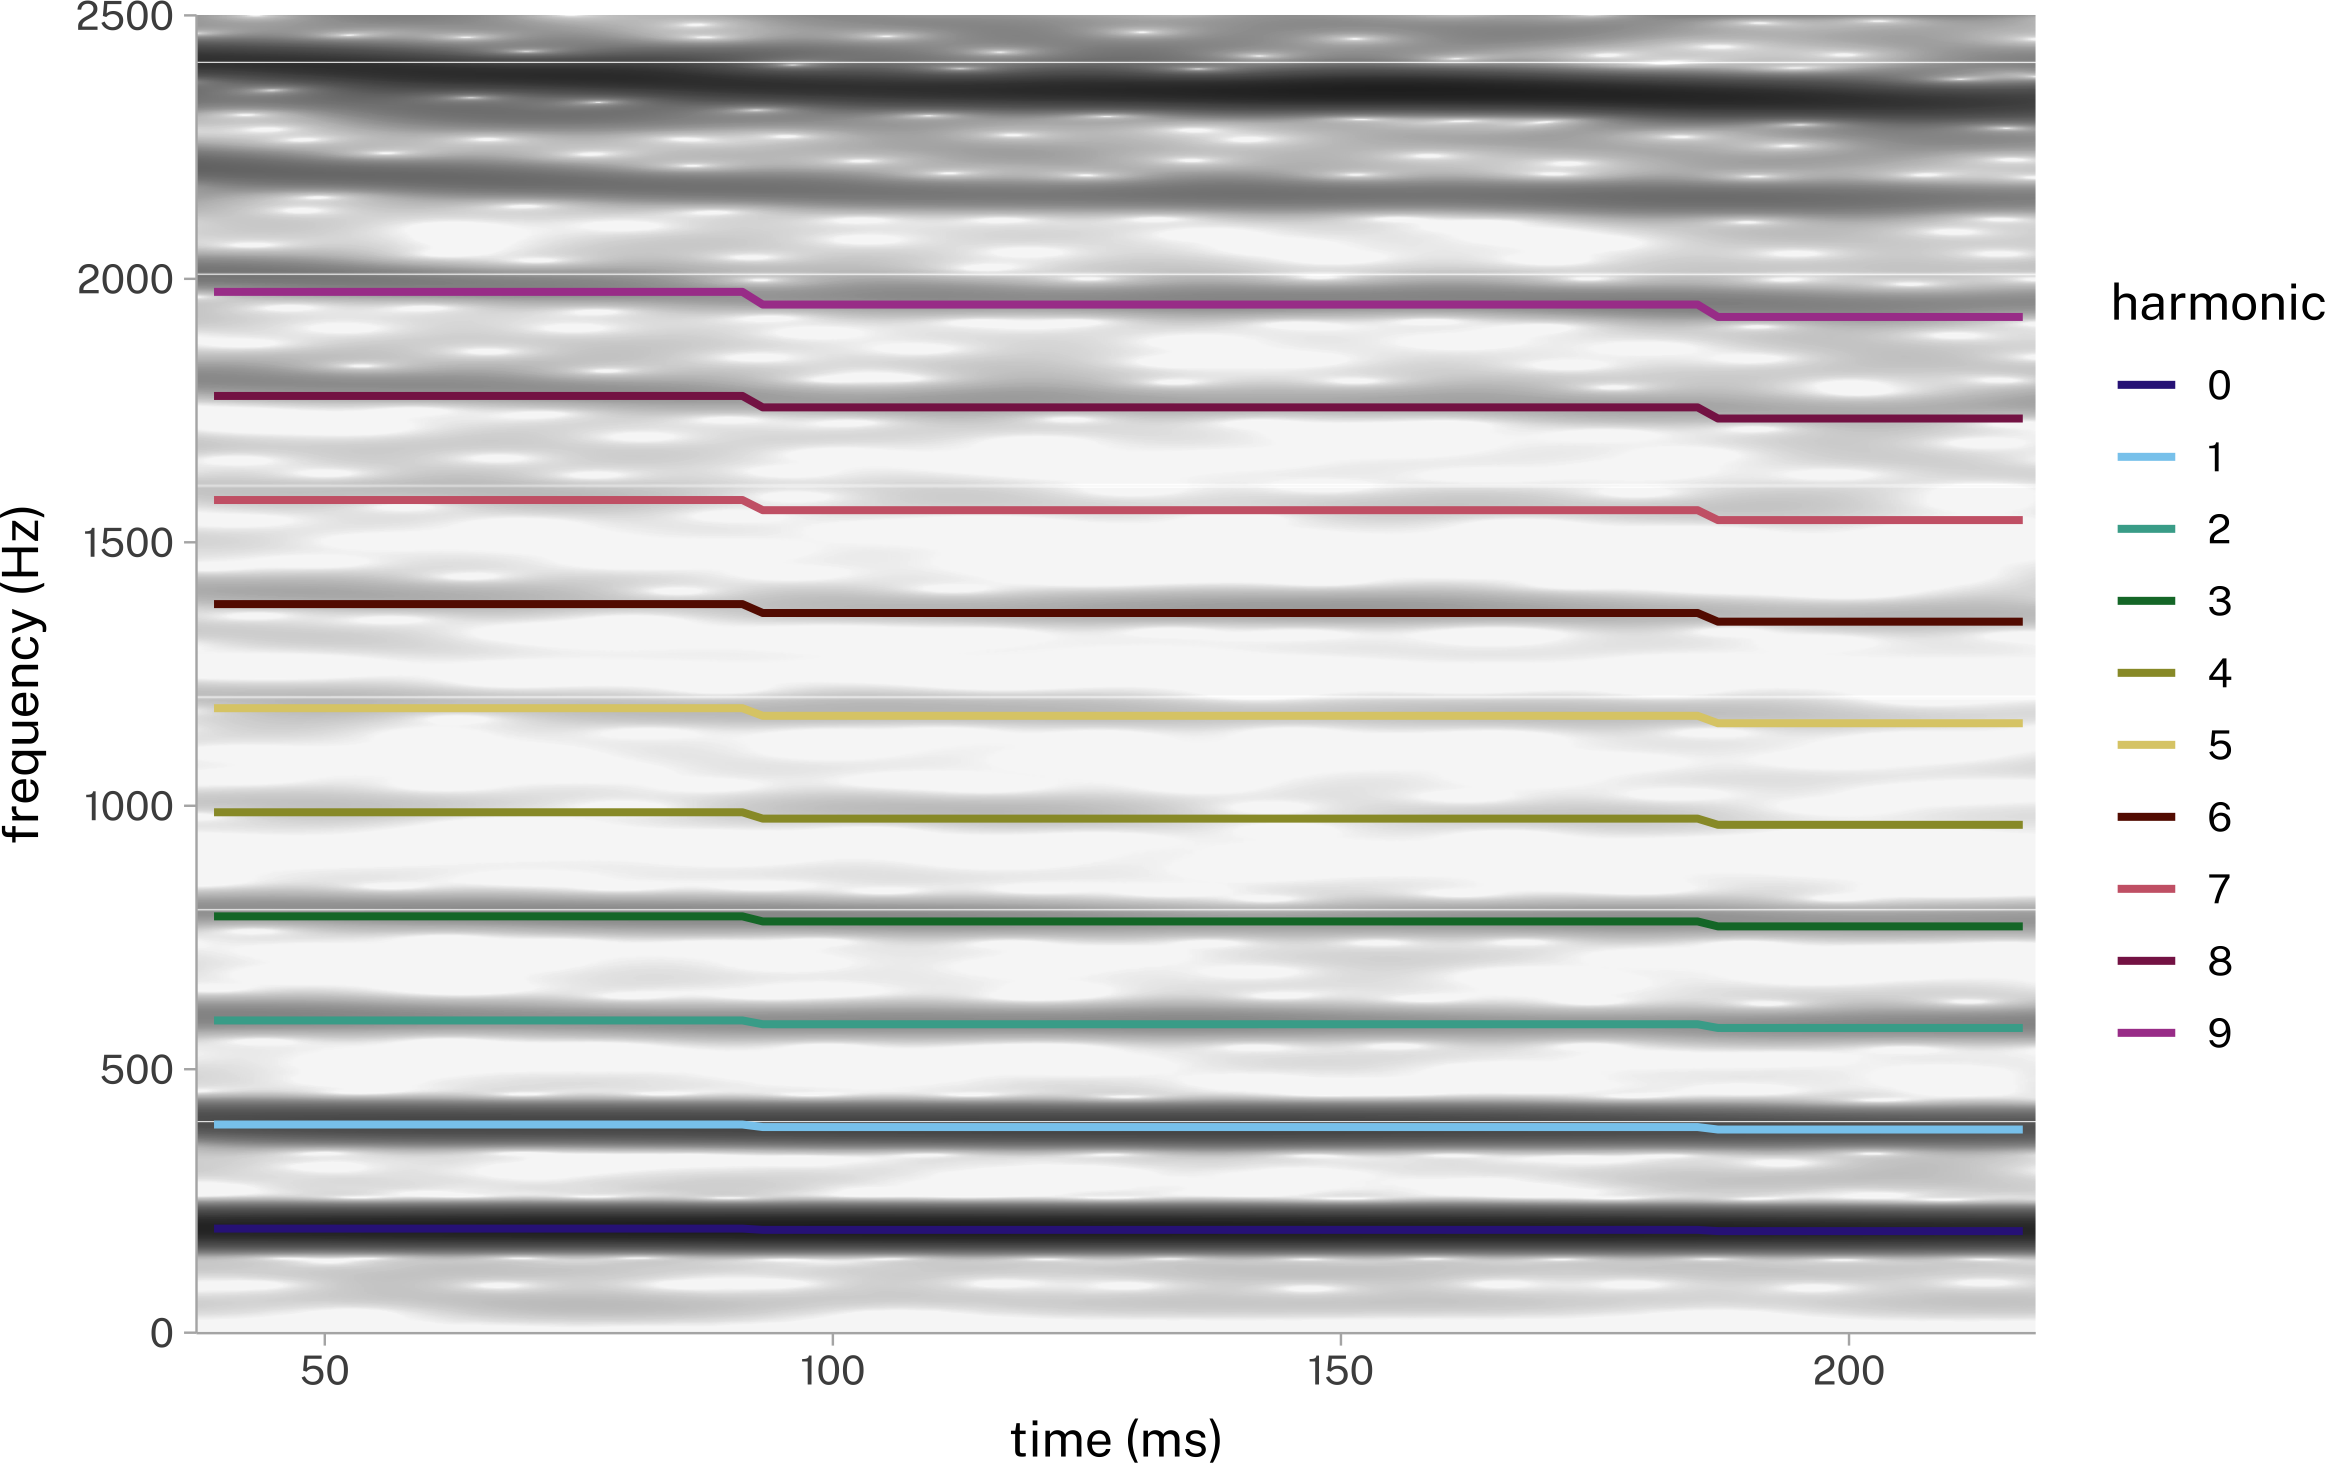
I suspect this because they were visually measuring the formants as printed out from a physical Spectrograph Machine. As such, it would be easier, and more principled, to record a formant value directly on one of the harmonics of F0.
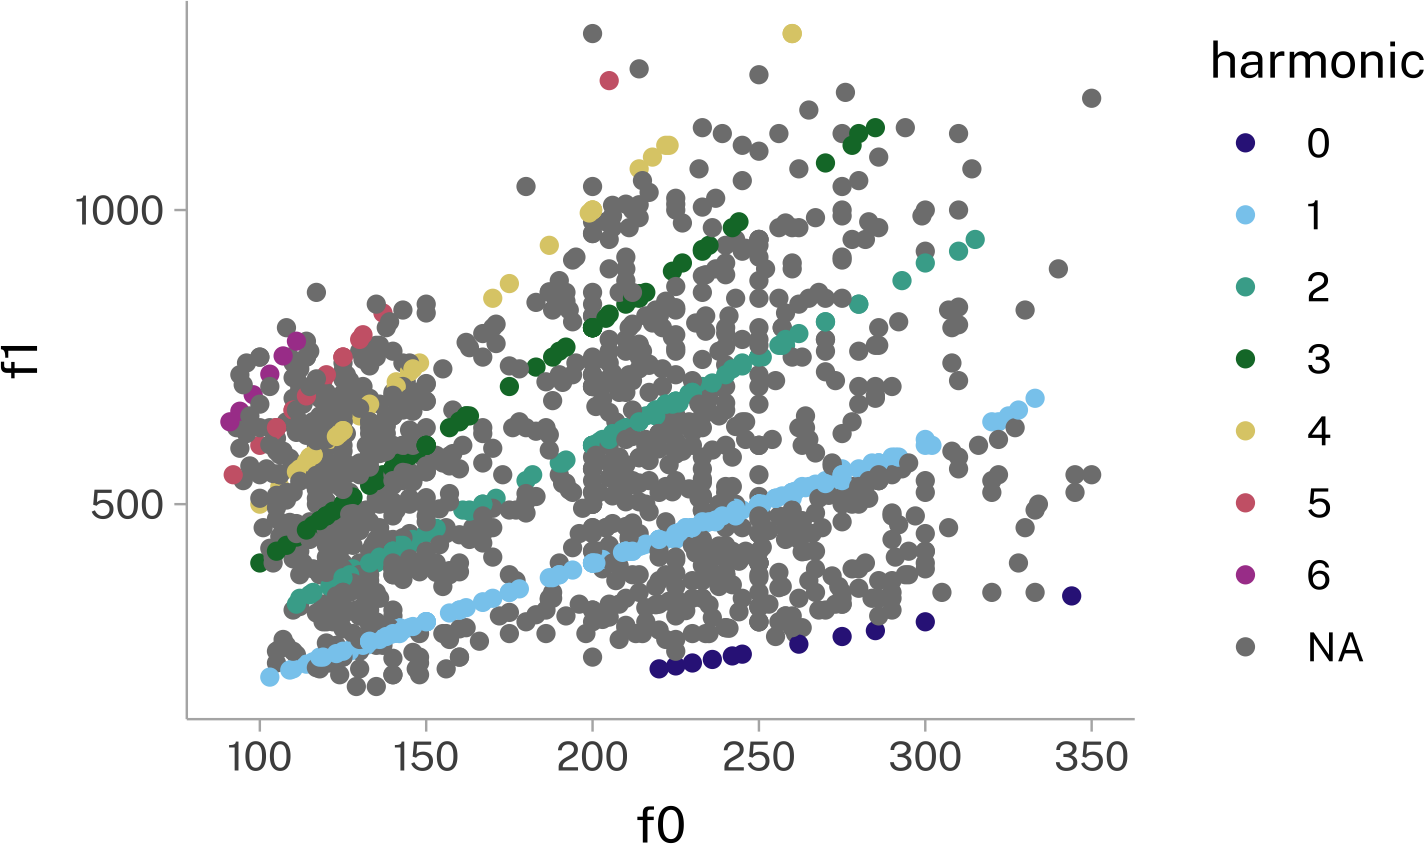
pb52 |>
mutate(
ratio = f1/f0,
rounded = round(ratio),
harmonic = case_when(
between(
ratio,
rounded - 0.05,
rounded + 0.05
) ~ rounded,
.default = NA
)
) ->
harmonic_coding- 1
- Get the f1:f0 ratio, and the closest harmonic of the fundamental frequency.
- 2
-
case_when()will evaluate a sequence of logical statements. Whentrue, it returns the value to the right of~. After all logical statements are evaluated, any.defaultvalue will be returned. - 3
-
between()will return true ofratiois greater thanrounded-0.05and less thanrounded-0.05. - 4
-
The value to return for all points that don’t satisfy the
between()condition.
harmonic_coding |>
  ggplot(
    aes(
      f0,
      f1,
      color = factor(harmonic-1)
    )
  )+
    geom_point()+
    labs(
      color = "harmonic"
    )
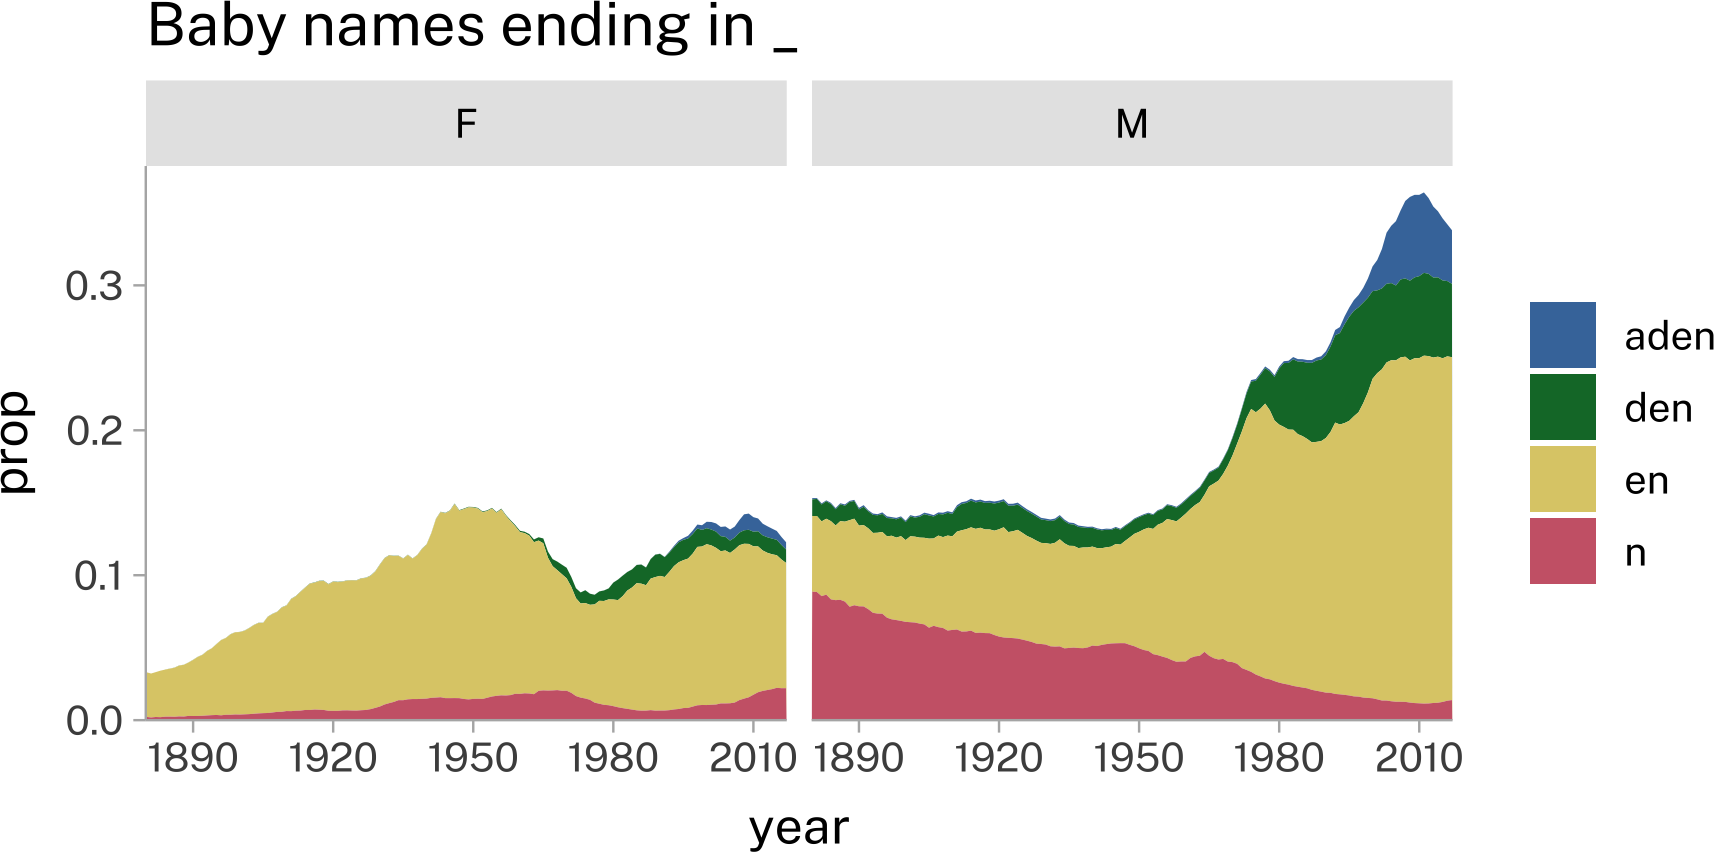
The rise of -aden
If you look at trends in babynames, one feature really pops out around the turn of the 21st century.
library(babynames)
library(geomtextpath)
babynames |>
mutate(
last_letter = str_extract(
name,
"\\w$"
),
last_letter = fct_lump(
last_letter,
n = 9,
w = n
)
) |>
summarise(
.by = c(year, sex, last_letter),
total = sum(n)
) |>
mutate(
.by = c(year, sex),
prop = total/sum(total)
) ->
last_letter_df
last_letter_df |>
ggplot(
aes(year, prop)
)+
geom_textline(
aes(
label = last_letter,
color = last_letter
)
)+
facet_wrap(~sex)+
guides(
color = "none"
)- 1
- This will pull out just the last letter from each name.
- 2
- This will clump together every letter that isn’t in the top 9 most frequent.
- 3
- This will get the total number of babies with the last letter by year by sex.
- 4
- This will calculate the proportion of babies who have this last letter in their name, by year and sex.
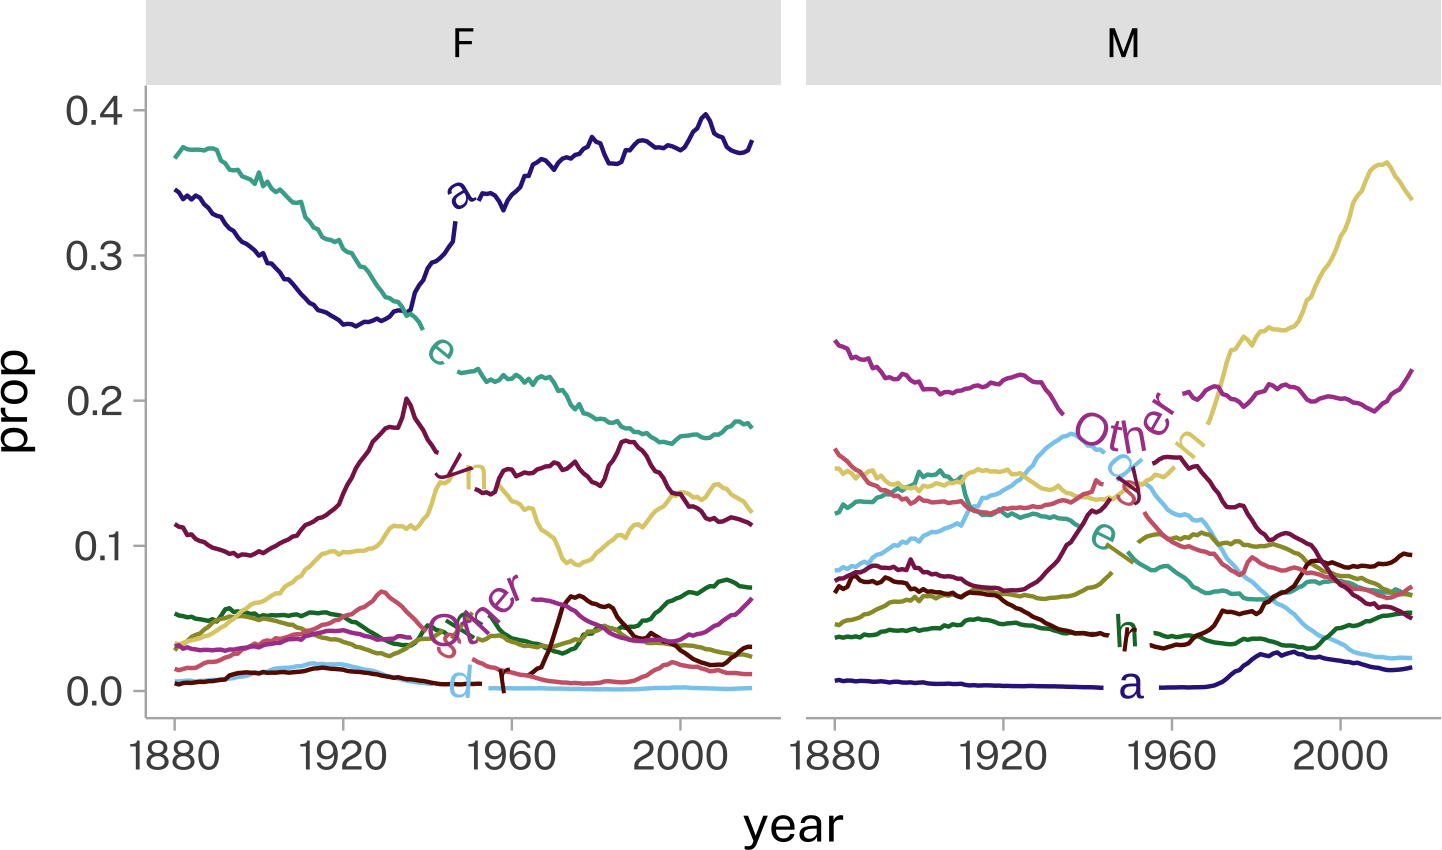
Boy names ending in <n> have shot up dramatically in popularity. But is it just any name, or have the final syllables /ej.dɨn/ disproportionately contributed?
babynames |>
mutate(
aden = case_when(
str_detect(
name,
"[aAe]i?y?[dt][aeiouy]n$",
) ~ "aden",
str_detect(
name,
"[dt][aeiouy]n$",
) ~ "den",
str_detect(
name,
"[aeiouy]n$",
) ~ "en",
str_detect(
name,
"n$"
) ~ "n",
.default = "other"
)
) |>
summarise(
.by = c(year, sex, aden),
total = sum(n)
) |>
mutate(
.by = c(year, sex),
prop = total/sum(total)
) |>
filter(
aden != "other"
) |>
ggplot(
aes(
year,
prop,
fill = aden
)
)+
geom_area(
position = "stack"
)+
scale_y_continuous(
expand = expansion(mult = c(0, 0.05))
)+
scale_x_continuous(
expand = expansion(0)
)+
facet_wrap(~sex)+
labs(
title = "Baby names ending in _",
fill = NULL
)- 1
-
case_when()executes each logical statement in order. If one returnsTRUE, none of the rest are evaluated. - 2
-
Trying to capture
PaytonandAidenandBradenetc. - 3
-
If not the /ey/ vowel quality, then names like
Landon,Easton,Eden. - 4
- Any vowel+N ending.
- 5
-
Any remaining names ending in n:
JohnQuinn. - 6
- Get the total number of babies in each year, in each sex, in each name ending.
- 7
- Get the proportion of babies in each year, in each sex, that have each name ending.
- 8
- For the purpose of plotting, I don’t care about “other”
Reuse
CC-BY 4.0
Citation
BibTeX citation:
@online{fruehwald2024,
  author = {Fruehwald, Josef},
  title = {Advanced {Data} {Operations}},
  date = {2024-09-18},
  url = {https://lin611-2024.github.io/notes/meetings/2024-09-18_advanced-data.html},
  langid = {en}
}
For attribution, please cite this work as:
Fruehwald, Josef. 2024. “Advanced Data Operations.”
September 18, 2024. https://lin611-2024.github.io/notes/meetings/2024-09-18_advanced-data.html.